 |

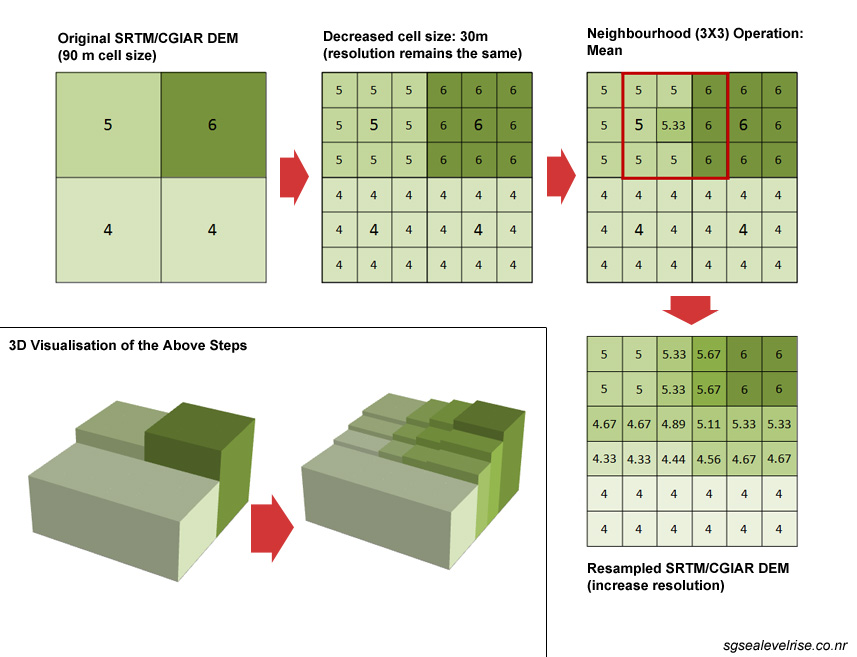
As the SRTM DEM for world-wide coverage is at a maximum resolution of only 3 arc-secs (approx. 90m), some resampling was required to increase the accuracy and resolution of the DEM.
More Info.
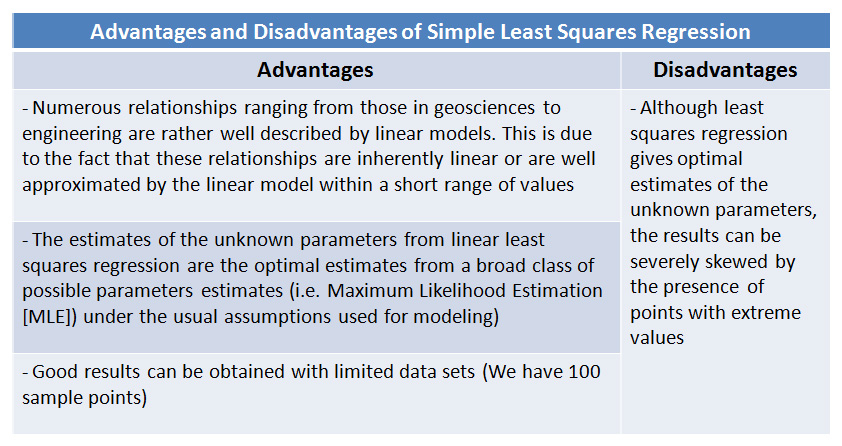
The linear least squares regression is a widely used statistical tool in many geosciences applications and the tool allows for rather accurate statistical inference to be made, with a few simplifying assumptions, regarding the dependency relationship between two variables. The formal mathematical representation of this model is as such:
 |
|---|
![]()
Yi : Dependent variable or regressand to be explained in the regression model
Xi : Independent variable or regressor within the model
B0 and B1 : Parameters of the regression model
Ei : Error term that contains all the factors beside Xi that determines the value of the dependent variable Yi, for a specific observation
Click here for more information on Simple Least Squares Regression.
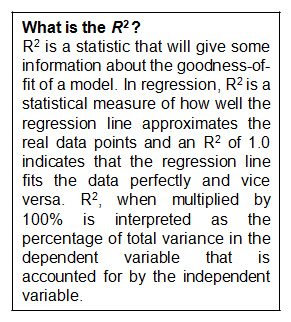
Click here to find out more about R Square.
Variables
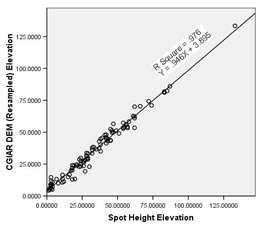
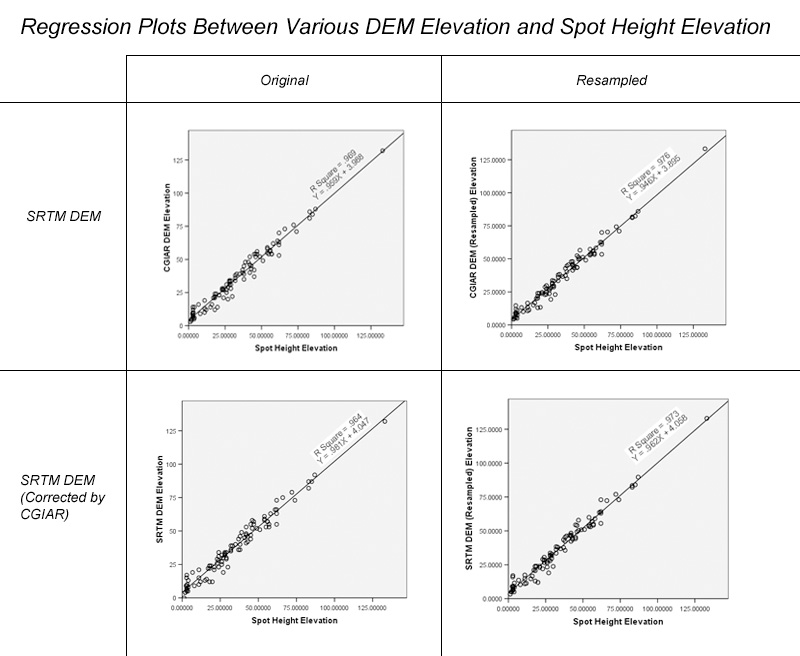
In our study, the independent variable is the Survey Height derived from sampled benchmark and spot heights on a 2002 version of a 1:50000 topographic map of Singapore. The dependent variables are the re-sampled DEM points from CGIAR and SRTM respectively.
Our regression was carried out using SPSS and the regression plots can be found HERE.
Calibration of Data to Ensure Accuracy |
|---|
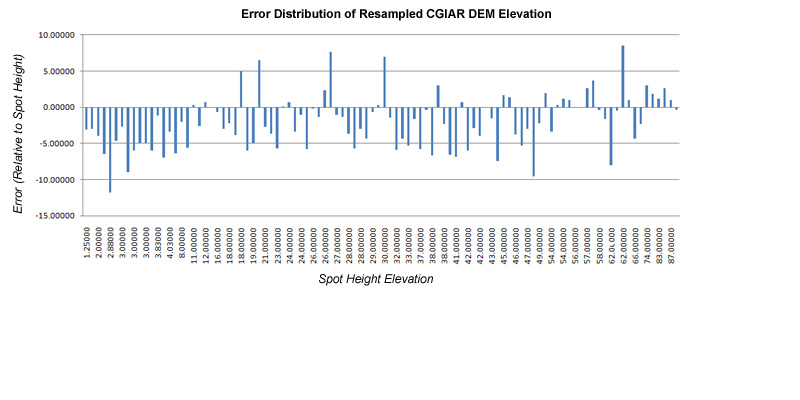
Before carrying out our analysis of sea level change on the Singapore’s coastline, we considered the error distribution of our resampled CGIAR DEM.
We summed the errors of the 100 sample points between the CGIAR_RS DEM and the 1:50000 Singapore topographic map and derived the mean error of the sample error. As most the errors are randomly distributed bi-directionally (negative and positive), calibration would not be meaningful on the dataset.
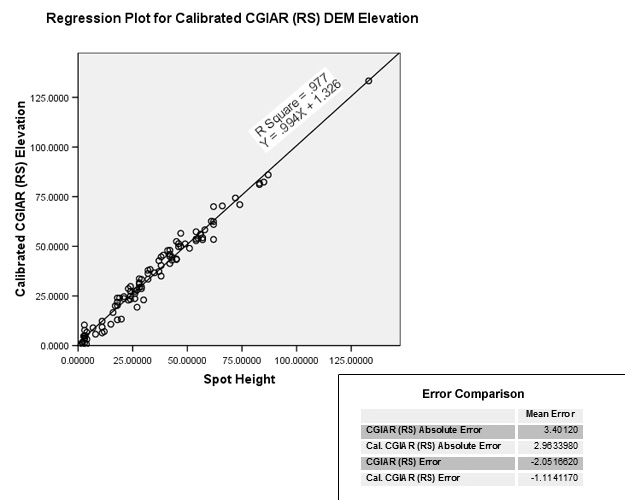
However, for the elevation data, from 0 - 15 m (in terms of Spot Height) the errors are distinctly one-directional (view error distribution chart). Hence, we calibrated DEM by adding the mean error from DEM cell values which fulfil the same criteria as the sample points.
The calibrated data showed distinct improvements in correlation, representation and error rate.
HERE IS THE ERROR COMPARISON AND REGRESSION ANALYSIS OF THE CALIBRATED DATA.
Correlation analysis was conducted to:
(i) Compare original SRTM DEM and CGIAR-processed SRTM DEM by finding correlation coefficient with more accurate Spot Height.
(ii) Compare between resampled DEM and original DEM by finding correlation coefficient with more accurate Spot Height
As such, the 4 DEMs below were tested:
SRTM DEM
SRTM (Resampled) DEM
CGIAR DEM
CGIAR (Resampled) DEM
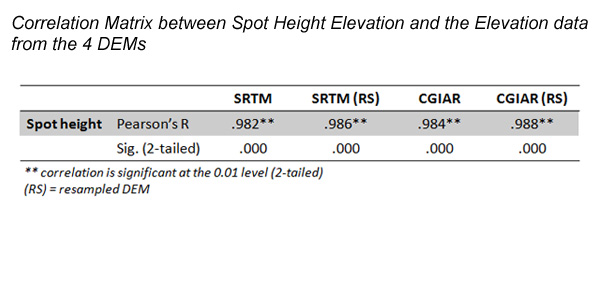
Results show that:
(i) resampled data consistently performed better than original data; and,
(ii) CGIAR (Resampled) DEM had the highest correlation coefficient of .988 (p<0.0005)