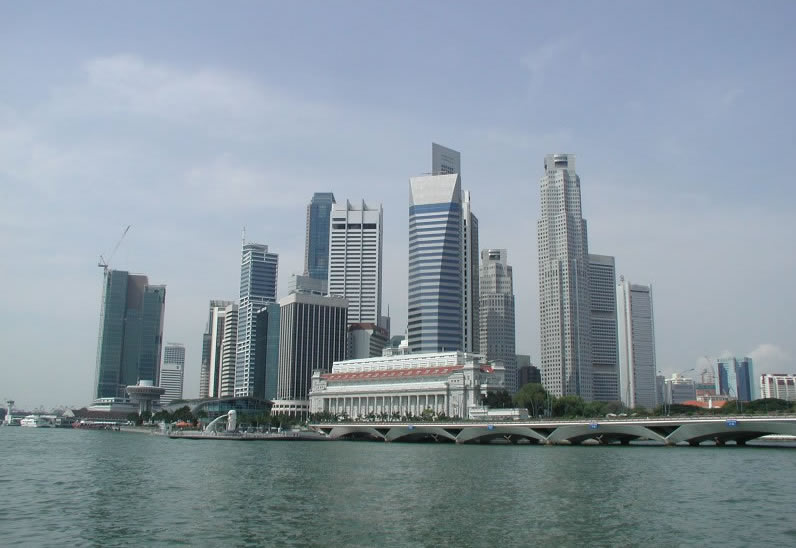
About Singapore
The island state of Singapore (1°18′N, 103°51′E) is located near the equator and is classified as having an equatorial climate (Af under the Koppen climate classification). The geographical location of Singapore and the exposure to maritime influences results in high temperature, humidity and precipitation year-round, with a diurnal temperature range almost 10oC – minimum of 23 to 26°C and maximum of 31°C to 34°C, with extremes of 19.4°C and 35.8°C respectively (NEA).
The total land area of Singapore is approximately 700 sq km with a coastline 193 km in length. As Singapore is an important economic and industrial centre in the region of Southeast Asia, its landuse tends towards heavily urbanised urban centres.
|
|
iiiiii |
| iiiii |
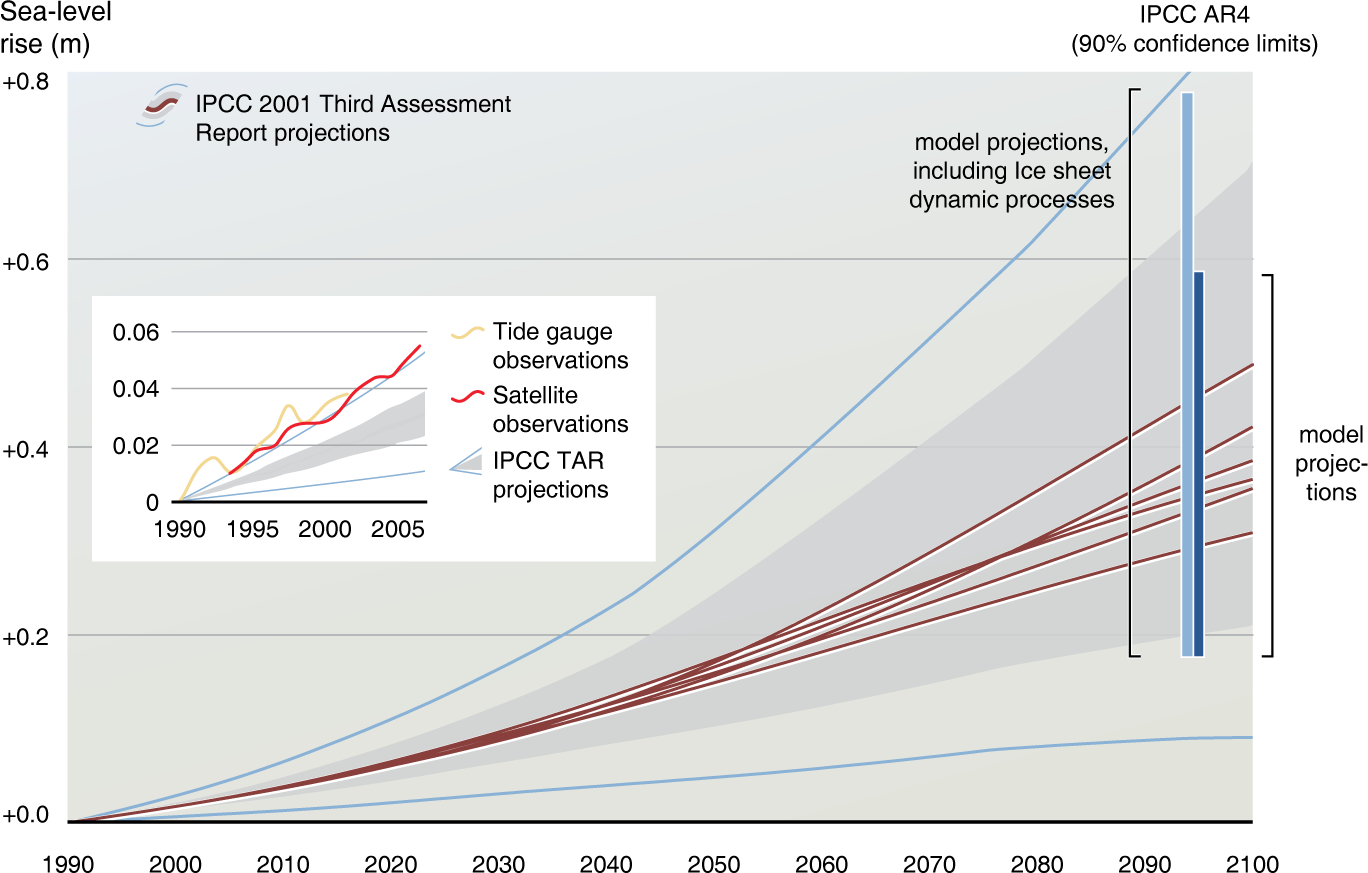
Global Warming and Rising Sea Levels
In its 2001 assessment of global warming, the Intergovernmental Panel on Climate Change (IPCC) projected that global mean sea level is expected to rise between 9 and 88 centimetres by 2100, with a 'best estimate' of 50 centimetres.
A warmer world will have a higher sea level because as the land and lower atmosphere of the world warm, heat is transferred into the oceans. When materials are heated they expand (thermal expansion). So the heat that is transferred causes sea water to expand, which then results in a rise in sea level.
In addition, water from land-based ice such as glaciers and ice sheets may enter the ocean, thus adding to the rise. A point to remember is that no extra water is added to the oceans when ice floating in the ocean melts. As floating ice melts, it only replaces the volume of water that it originally displaced. |
iiii |
iii
|
|
SRTM
The Shuttle Radar Topography Mission (SRTM) obtained elevation data on a near-global scale to generate the most complete high-resolution digital topographic database of Earth.
More info.
CGIAR-CSI
Consortium for Spatial Information (CGIAR-CSI) of the Consultative Group for International Agricultural Research (CGIAR) post-processed 3-arc second DEM data for the globe. The original SRTM data has been subjected to a number of processing steps to provide seamless and complete elevational surfaces for the globe.
More info. |
|
| |
What we can expect
This projected sea level rise will wreak havoc ranging from coastal flooding and storm damage, eroding shorelines, salt water contamination of fresh water supplies, flooding of coastal wetlands and barrier islands, and an increase in the salinity of estuaries. Some low lying costal cities and villages will also be affected. Resources critical to island and coastal populations such as beaches, freshwater, fisheries, coral reefs and atolls, and wildlife habitat is also at risk.
The Greenland and West Antarctic ice sheet
Climate models done by IPCC shows that the local warming over Greenland is likely to be one to three times the global average, approximately larger than 3°C and if sustained for millennia, it would lead to virtually a complete melting of the Greenland ice sheet with a resulting sea-level rise of about 7 m. Similarly, the West Antarctic ice sheet (WAIS) could contribute an additional six metres (20 feet) to sea level rise. Although the chances of this are considered "low" in the IPCC’s Third Assessment report, recent research indicates new evidence of massive ice discharge from the WAIS. |
|