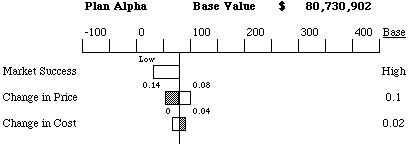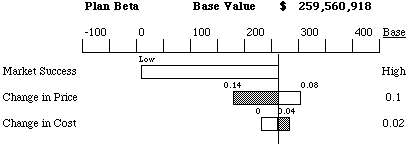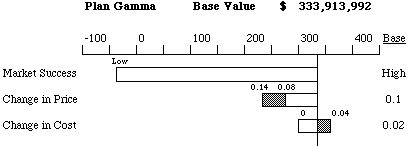
Now we can evaluate how each of the uncertainties affect the resulting NPV of the whole project.
Tornado diagrams offer an effective tool for representing results of
the deterministic sensitivity analysis. First, the all the variables in
the value model are set to the "Base" value. The resulting NPV is the "Base
Case" value for the alternative. Then, for each of the variables
in turn, the model is evaluated at the low value of the variable and then
at the high value of the variable (with all other parameters kept at their
base value). The difference between the low and high value of the model
is a measure of how sensitive the problem is to change in that variable.


An interesting thing happens here: for both low and high values of Change
in Price variable, the NPV of the alternative is smaller than for the base-case
Change in Price. It can be explained easily: if the price drops by
a large amount per year the company will enjoy higher demand, but lose
on the revenues. When the price does not drop by much, the demand will
not be there. The base-case value balances the two effects: the price is
high enough to bring in sufficient revenue and is low enough to attract
customers.

The tornado diagrams show that the Change in Cost uncertainty does not
seriously affect the NPV. This means that in further analysis it is possible
to set its value to the "Base" value and consider it as constant. However,
Market Success and Change in Price have to be investigated further in the
probabilistic analysis.
![]()
|
|
|