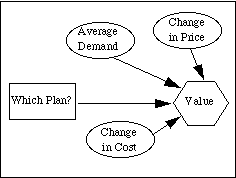
A decision diagram is a simple graphical representation of the components of a decision problem. It illustrates the relationship among the choices, uncertainties and resulting values.
The decision to be made was defined previously: it is a choice
between three plans: Alpha, Beta and Gamma. Each plan will result in some
value for the company. In the decision diagram the decisions are represented
by rectangles and the resulting value is represented by a hexagon.

What are the unknown quantities (uncertainties) that make this decision
difficult?
The first one is rather obvious: it is hard to predict the future demand for electronics. Some products become more popular than other. The technology changes very rapidly and the market is highly competitive. If the average demand over the next ten years is high, it will be very important to have enough production capacity to take full advantage of such opportunity. If the demand is low, the money invested in a large plant will not be justified. So, the demand will affect the resulting value of the project to VOSI. It is an uncertainty and is represented by an oval in the decision diagram. An arrow pointing to the value node represents relevance between the average demand and the value to the company.
Another unknown is the production cost in the future. Things are stable now, but what happens if the labor costs go up, material costs skyrocket, or a supplier goes out of business? On the other hand the technology gets better every year and the suppliers compete on value, so there is a good chance that the cost of materials will go down. All of these factors will change the present production cost per unit. We don't know the exact change of the production cost for every year. So, we should include the Average Change in Production Cost (we will refer to is as Change in Cost) uncertainty into our analysis.
Even though the company knows the market price of Virtual Assistants now, as technology improves and more competitors enter the market, the average market price will drop. In order to stay competitive, VOSI will have to adjust their average wholesale price according to the market price. Unfortunately, just as with the production cost, the exact price change for each year over the next ten years is not known. As a result we can define the Average Change in Market Price (referred as Change in Price) as another uncertainty.

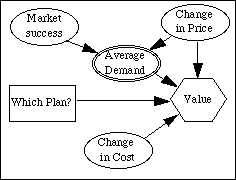
The average demand in the future will depend on the price: the lower the price, the higher the demand (an interesting economic phenomenon). In order to represent this relevance information an arrow is drawn between the Change in Price and the Average Demand uncertainties. This arrow says that knowing the future price changes may provide information about future demand.
The demand will also depend on the overall market success of the product. Since it is rather new to the market, we can only guess how popular it will be over the next ten years. Even if the price is low, the demand will not be very high if the product is not popular. However, if the product is very popular, the high price may not have a significant impact on demand.
If we knew both the future market success of the product and the average
change in price over the next ten years, it might be possible to predict
the average demand for the next ten years. For the purpose of this
demonstration we will assume that given Change in Price and Market Success,
we will know for sure what the Average Demand will be. In this case
the Average Demand is not an uncertainty, but a function of the other two
and it is represented by a double oval in the decision diagram.

|
|
|