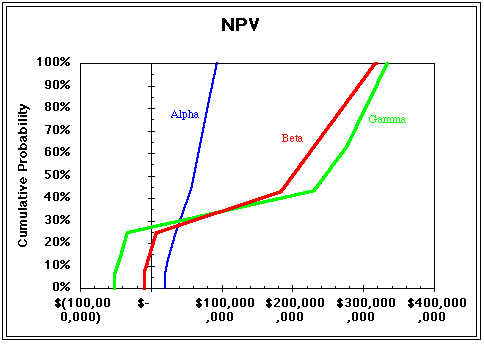
We now can summarize the probability distribution of NPVs to evaluate
the risk associated with each alternative. The following cumulative
probability distribution chart shows the probability of the NPV being less
than or equal to a particular value for each alternative. For example,
there is a 20% chance that plan Beta will result in NPV that is $0
or less and there is 100% chance that plan Alpha will result in NPV of
$100 million or less.
From the cumulative probability distribution chart we can conclude that plan Alpha will be less risky because its range of possibilities is narrower than that for plan Beta or Gamma. However, there is about 65% chance that plan Beta and Gamma will realize the value that is greater than the highest possible value with plan Alpha. Plan Gamma has the potential to have the highest NPV, but at the same time it has about 27% chance of resulting in NPV that is less than 0.
Our probabilistic analysis shows that plan Beta is the best plan to go for - it combines moderate risk with relatively high expected payoff. This alternative has the highest certain equivalent ($57,405,496), thus the initial recommendation is to go with plan Beta.
![]()
|
|
|